Every now and then we think it’s nice to give you an update on the local housing market.
So here are a couple of facts that you should find interesting…
As of June 2022 (the latest index report as of August 2022) the average sales price in Rugby was £247,031. This has decreased from £258,101 this time last year (Approx. £11,000).
However, Rugby property prices still sit just over £4,000 higher than the ‘pre-pandemic level’ in December 2019 when the average house price in Rugby sat at £242,826.
It is, however, lower than the peak that the Rugby market hit in June last year (2022) which was £258,101
These are the tell-tale signs that the housing market in Rugby is slowing down – but not by much. We are now entering a phase of the housing market that we would consider “stable and normal”.
1o% of sales in the past 12 months were flats, achieving an average sales price of £127,341. 90% of all sales were houses, achieving an average price of £265,906.
Purely for your interest, the highest value recorded by the Land Registry over the past 12 months was £325,000 for a flat and £1,225,000 for a house.
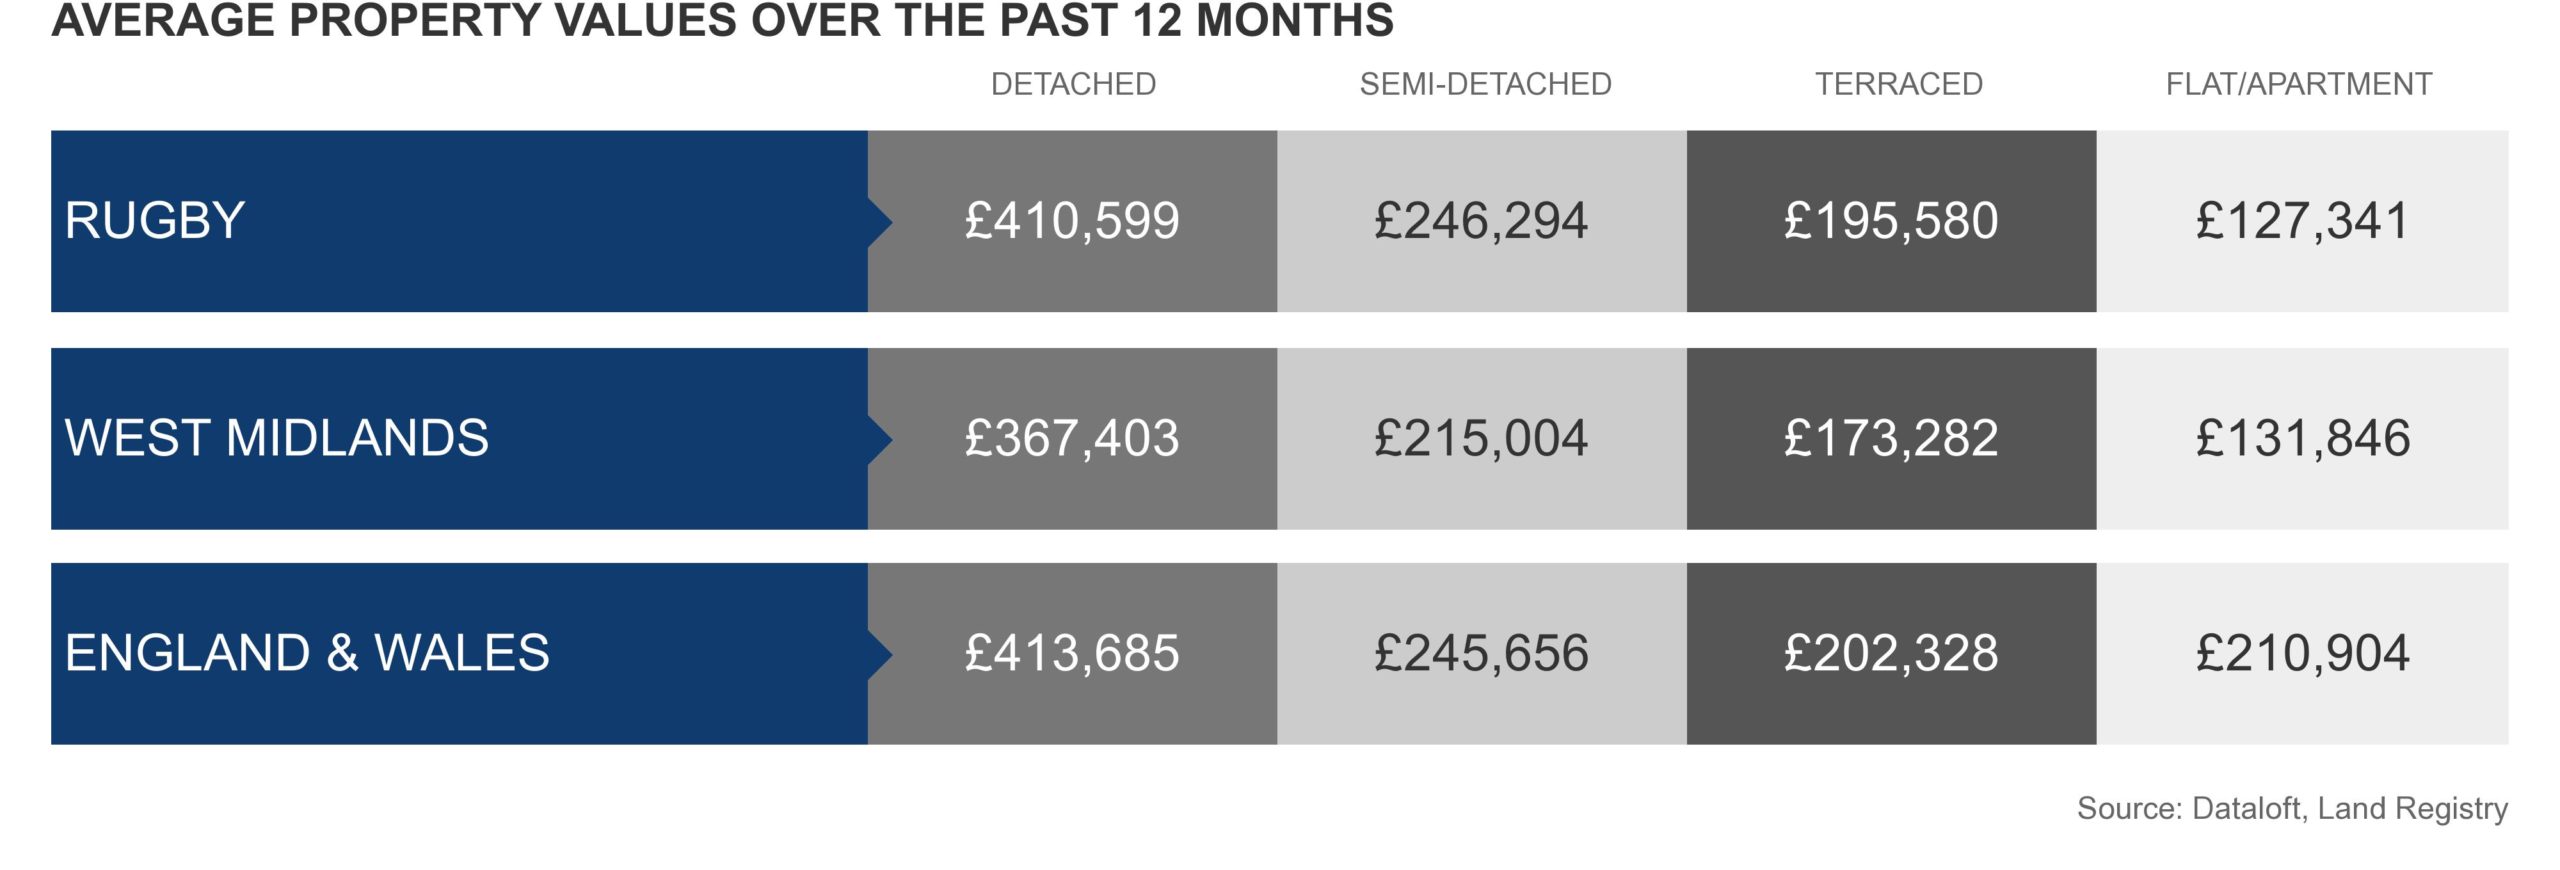
Detached houses in Rugby are selling for £43,196 more than the West Midlands average (Just £3,000 below the national average). Detached houses in Rugby have increased by approximately 7.27% in the last 12 months (approximately £28,000).
Semi-detached properties sell for £31,290 more in Rugby than the West Midlands average (and slightly higher than the national average). Semi-detached houses in Rugby have increased by approximately 0.16% in the last 12 months (approximately £393).
The data is currently telling us that although the market is slowing, detached properties in Rugby appear to still be increasing in value quite significantly.
A slowing market?
There are now less property transactions going through with us seeing a decline in Rugby for four months in a row now.
This doesn’t necessarily mean the market is going quiet. It is more likely due to the slow transaction time due to delays that solicitors are currently facing.
Find out more about that here: campbell-online.co.uk/taking-longer-to-move-house/
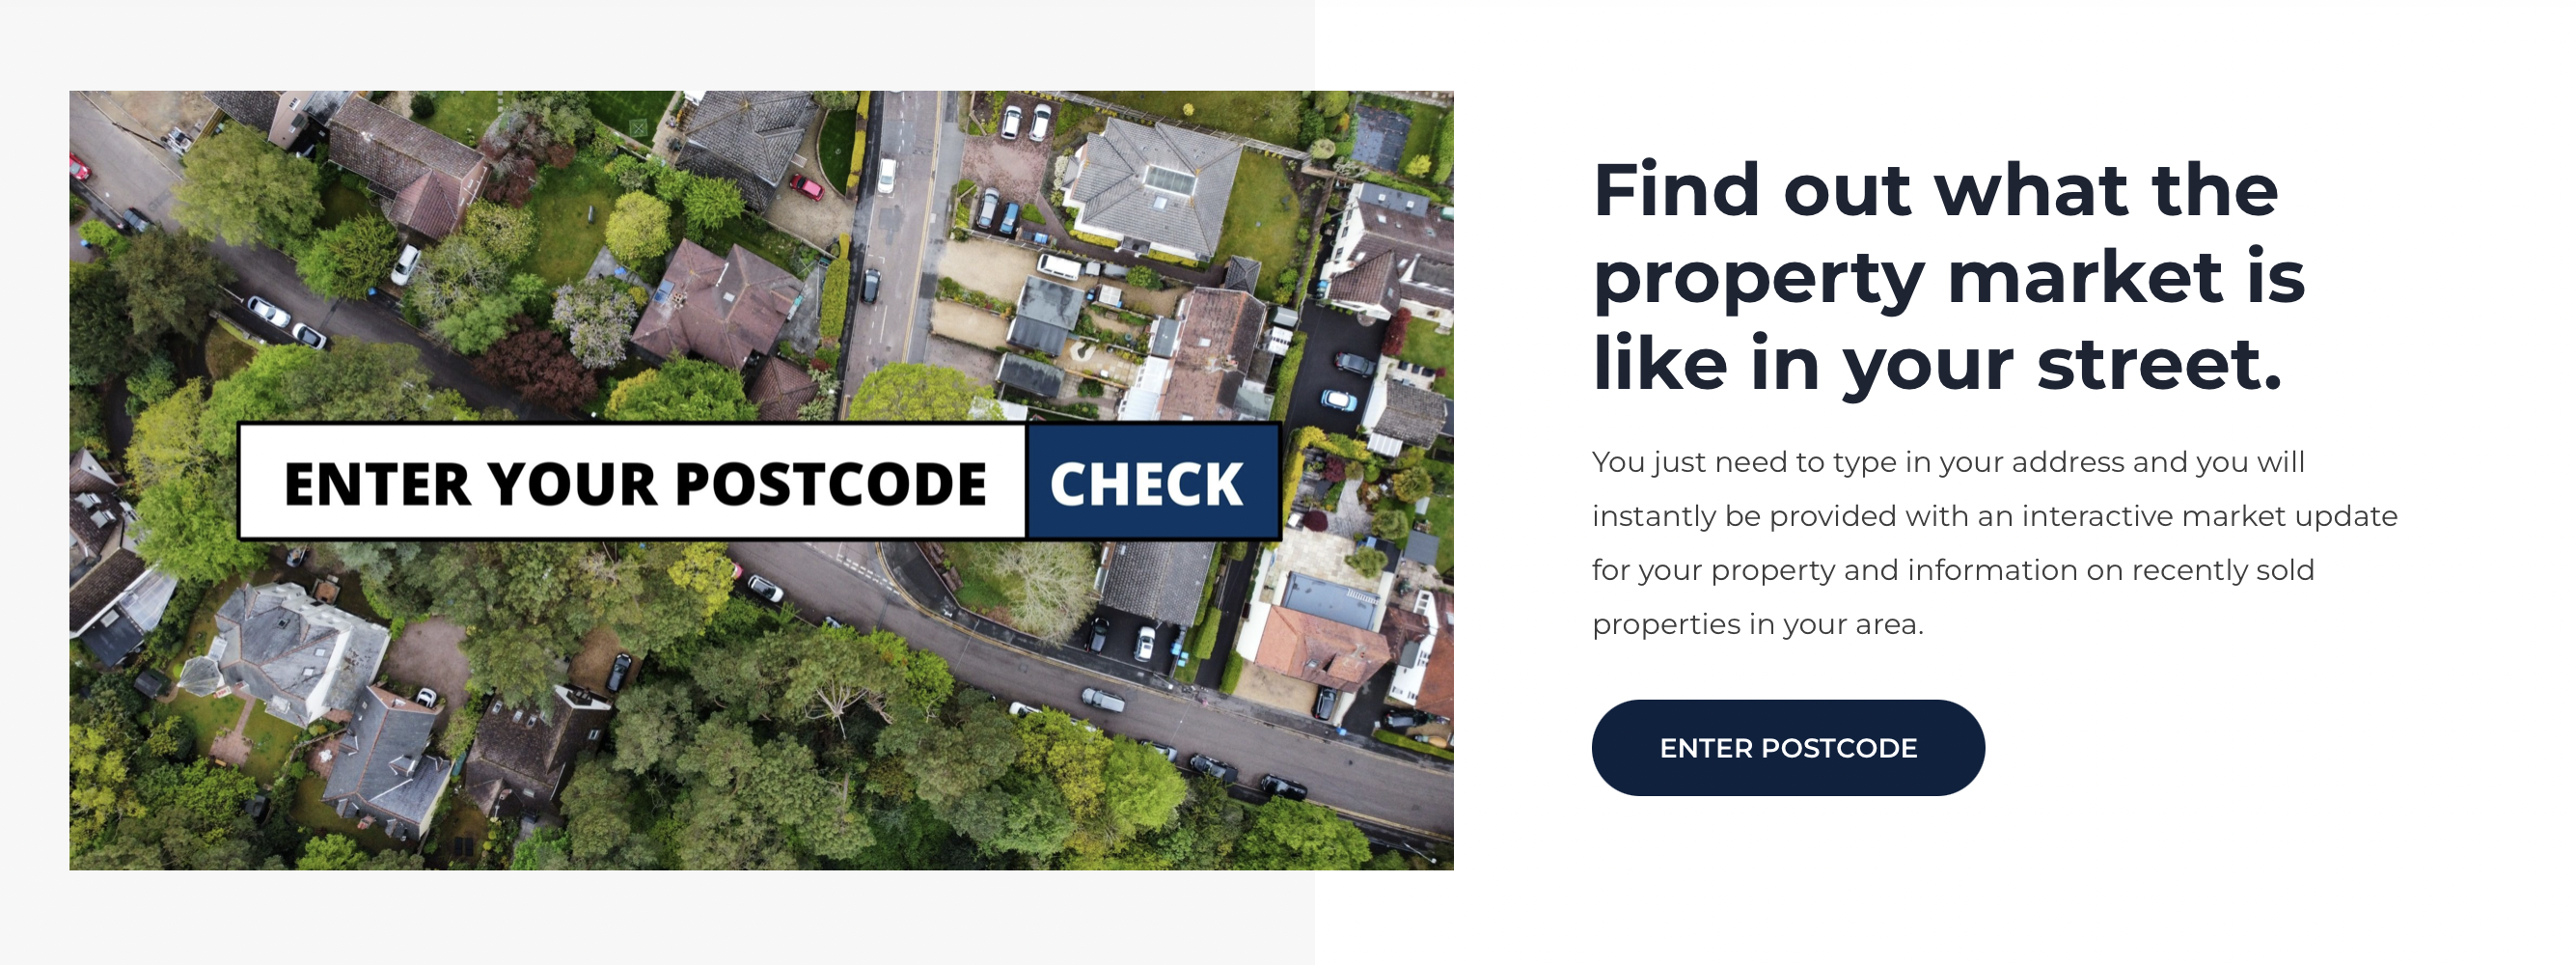
It is important to remember of course that these statistics are just averages and actual property market trends can change from street to street.
You can click the links below to either get a market report for your street or you can get a free online valuation for your property in 60 seconds.
Soure: Dataloft. Information is based on June 2022 (the latest property index, as it runs two months behind)